Using Telegraf, Flux, InfluxDB and Grafana to Join Queries
I wanted to achieve a very simple thing - my graph showing CPU usage per core should be normalized. Regardless whether a machine has 8 cores or 2, I want to see the CPU usage as a percentage out of 100. This cannot be achieved using InfluxDB and InfluxQL at the moment as it does not support cross joining of measurements from InfluxDB as sourced from Telegraf, which stores the number of CPUs in the system measurement and the per core CPU usage in the cpu measurement.
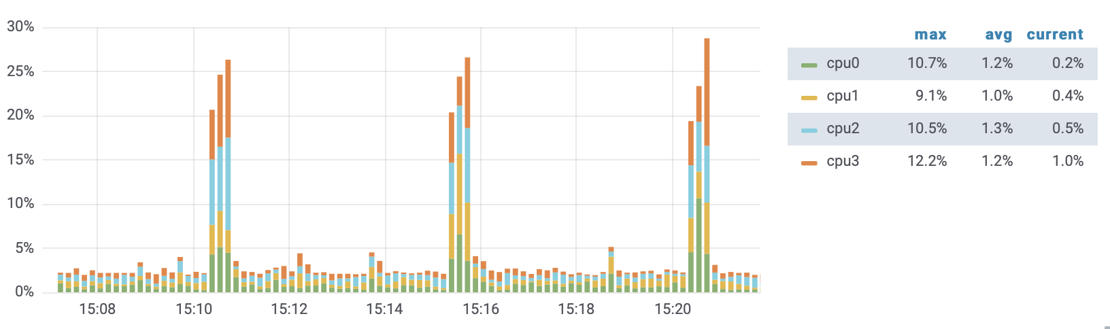
Flux is a new language to be part of InfluxDB 2.0, which is currently still in Alpha. A more limited version of Flux is available with InfluxDB 1.7+. It took me quite some time but eventually I figured out how to write a Flux query that will work in Grafana with the BETA Flux (InfluxDB) plugin to create this:
Here is the code:
a = from(bucket: "telegraf/autogen")
  |> range($range)
  |> filter(fn: (r) => r._measurement == "system" and (r._field == "n_cpus" and
      r.host =~ /^$source$/))
  |> window(every: $__interval)
  |> mean()
  |> duplicate(column: "_stop", as: "_time")

b = from(bucket: "telegraf/autogen")
  |> range($range)
  |> filter(fn: (r) => r._measurement == "cpu" and (r._field == "usage_idle" and
      r.host =~ /^$source$/ and r.cpu != "cpu-total" ))
  |> window(every: $__interval)
  |> mean()
  |> duplicate(column: "_stop", as: "_time")

join(tables: {a:a, b:b}, on: ["_time", "_stop", "_start", "host"])
  |> map(fn:(r) => ({
    _time: r._time,
    _cpu: r.cpu,
    _field: _cpu,
    _value: (100.0 - r._value_b) / float(v: r._value_a)
  }))
  |> group(columns: ["_cpu"])