Troubleshooting slow system performance
I have a client that suffered for the past couple of months from poor performance on their Windows 2008 terminal server. Part of the problem was due to additional load placed on the system by various users' activities. But there was a deeper cause. The following steps highlight the troubleshooting process I took.
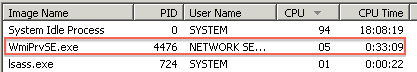
- First and foremost I had to figure out if the system slowness is quantifiable or if it is just user perception. For this I fired up the trusty Task Manager and sorted the processes by CPU usage. One jumped out - WmiPrvSE.exe. It consumed between 4% and 10% of CPU time consistently. This process is the Windows Management Instrumentation service host process that basically provides a system instrumentation service for clients.
Task Manager CPU Usage for WmiPrvSE.exe - 5% - Since this service is a Windows process and is really a service provider it did not help me much. I still did not know which client process was consuming so much CPU time via WMI calls. So I fired up Process Explorer from Sysinternals. This allowed me to drill down much deeper than what Task Manager allows.
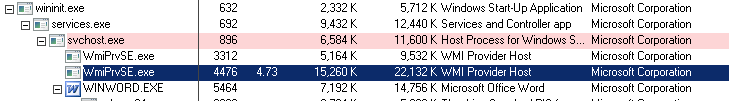
Process Explorer Process View - Next was to figure out why this process is using so much CPU time. Seeing that it is a wrapper process I was hoping the Threads view would help out.
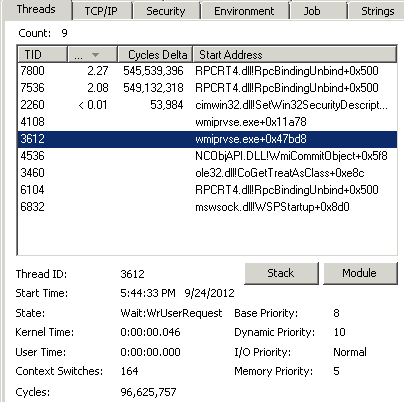
Process Explorer Threads View - That pointed to a system DLL called RPCRT4.dll which basically deals with remote procedure calls. It did not really help me. Next I reviewed some other details, such as the IO requests. It was extraordinary high. The real screenshot was much higher as this view was captured moments after a server reboot.
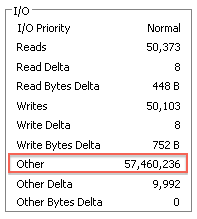
Process Explorer IO View - Ok so now we have a system service that has high IO counts and consumes too much CPU. I decided to enable WMI trace logging. It did not lead anywhere.
- Next step was to investigate the IO count. I fired up Process Monitor also from Sysinternals. This utility provides insights as to what files / handles an application has open or is accessing. I ran it for a couple of seconds and filtered on wmiprvse.exe.
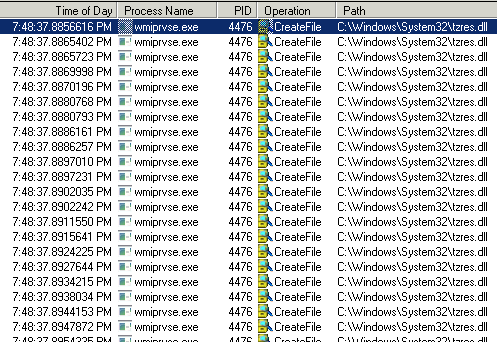
Process Monitor - wmiprvse.exe - Note all the calls to CreateFile on a file called tzrez.dll. Firstly, CreateFile is a Win32 API call to open / create a file. In this case the call was to open the file for reading. This file is related to time zone information and is a system DLL. So we have a system service calling a system DLL excessively. This plot thickens. At this point I ran out of ideas so I went to Google...
- A quick search for "wmiprvse reading tzres.dll" yielded this link. Reading it revealed the issue is with Windows System Resource Manager. A quick disabling of the Windows Resource Manager service confirmed this to be the culprit WMI client process - the CPU usage dropped to 0% for WmiPrvSE.exe.
- Scrolling down I found this link: KB970067. It contains a hotfix and a registry change required to fix the issue. I still have to reboot the server but this seem to have fixed the issue.