AquaStats - Aquatronica Controller Software
A couple of days ago I purchased an Aquatronica Ethernet module as it only recently became available in South African LFS shops. I also have a Serial Interface , but therein lies a couple of problems. The first is that it uses RS232 serial port for connecting to a PC - the second problem. This means the PC has to be in close proximity to the controller (couple of meters). Furthermore, the software - although very nice for configuring programs/devices - is not really useful as a remote monitoring system.
It does not allow the definition of alert actions - one can only configure a sound on an alert but I never managed to get my laptop to produce a sound via the software. This is in any case not useful as the controller itself can already produce a sound on an alert condition. It cannot send emails, and it cannot log any data from the device - which is stupid.
See, the controller has a limited buffer to store either a month, week or day's worth of logging data per sensor. The longer period, the further apart the sample interval. For instance, if set to a week's buffer, the sample interval is once every 4 hours. For a month the sample interval is something like 16 hours - useless. Since the program displays real-time data, it would be easy for the developers to have added this feature, but as to this date the feature is still not implemented.
Since the protocol over the wire is proprietary and binary, and since I have neither the time nor the inclination to decode it, I settled for the inferior solution. Until a couple of days ago when I purchased the Ethernet Module.
Apart from the fact that one can configure it to send alerts via email,it provides a simple web portal for querying the status of the system. This is implemented using AJAX, which means it was trivial for me to write a program that interacted with the controller via TCP/IP (my ethernet network at home).
This is how my new baby was born - I started two days ago to write the software, and as I got time during my various other projects I managed to get this completed:
Screenshots
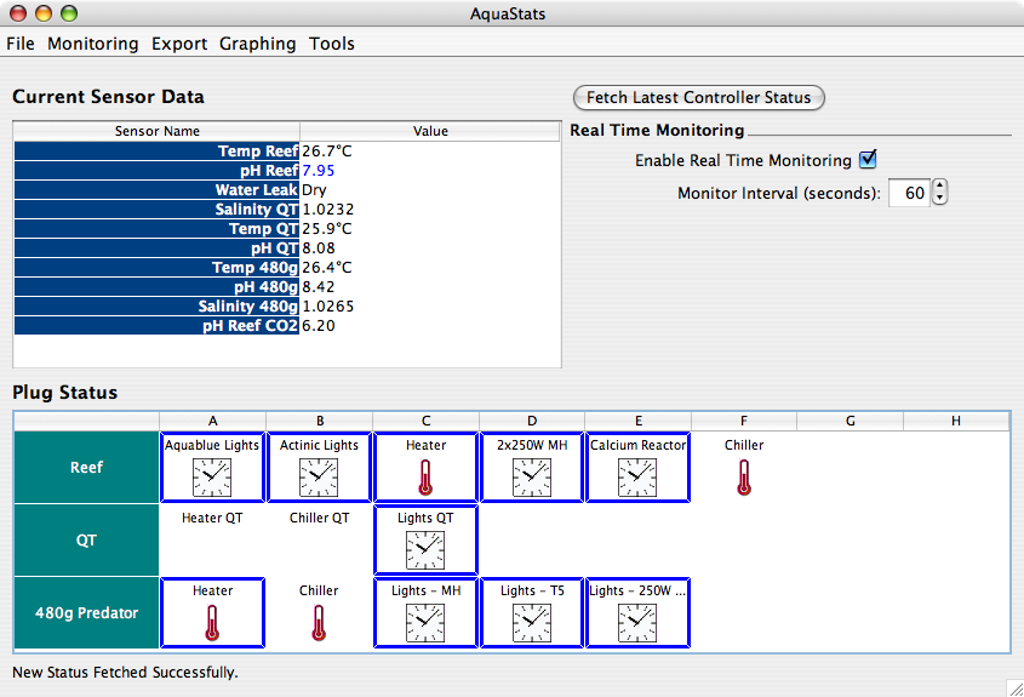
Main screen after launching application
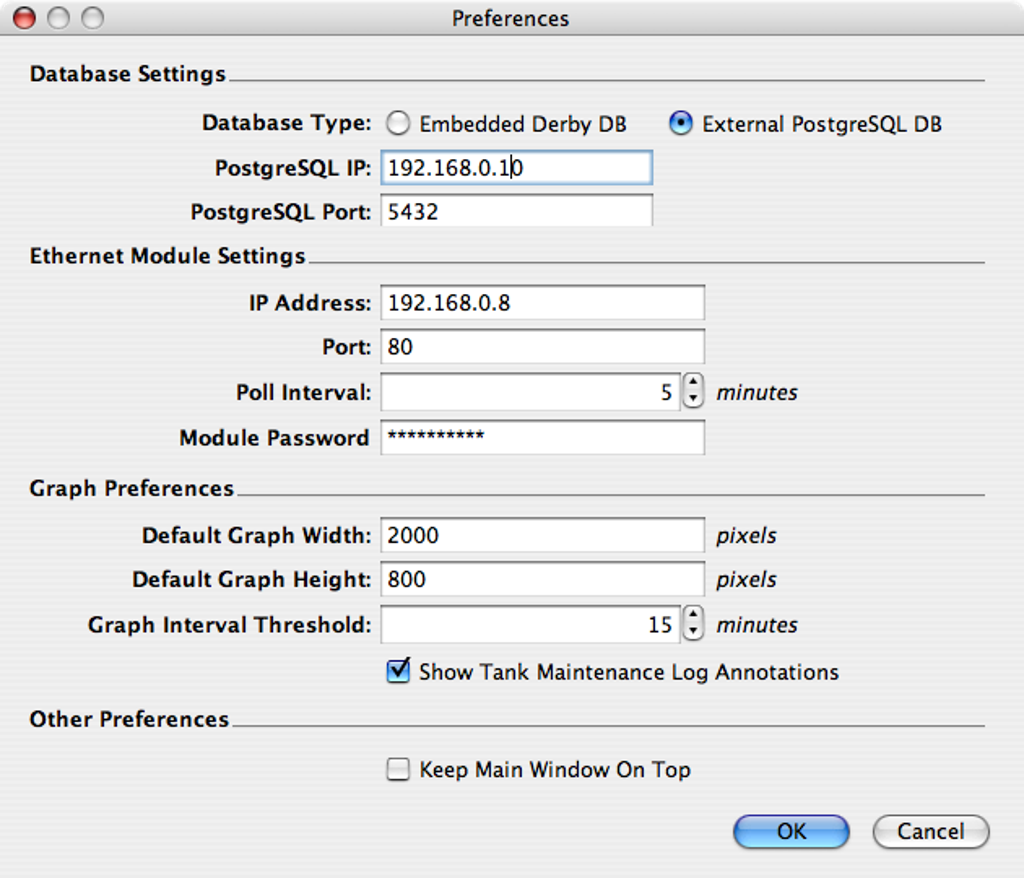
Application preferences. Notice that both an embedded as well as a remote database are supported.
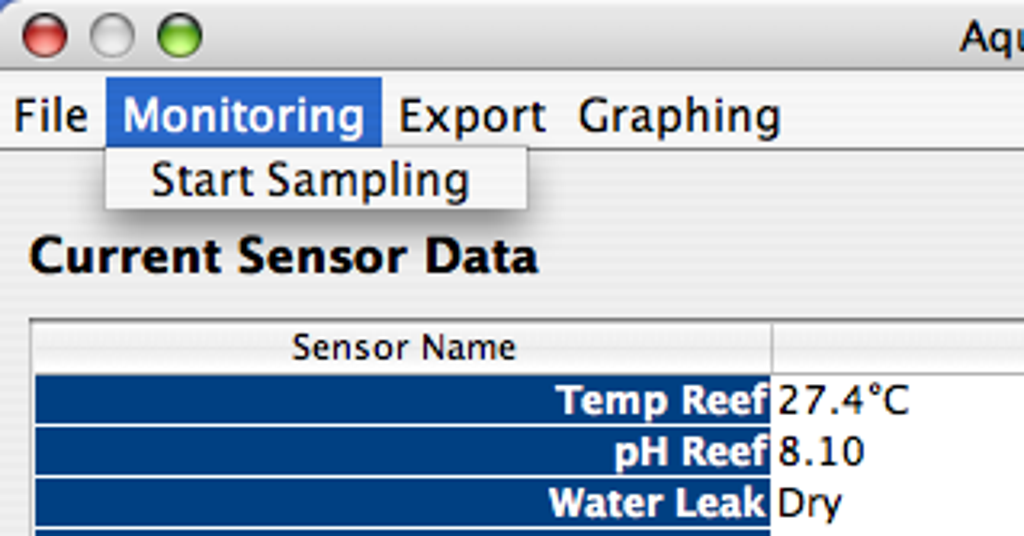
Visual way of starting the sampling process.
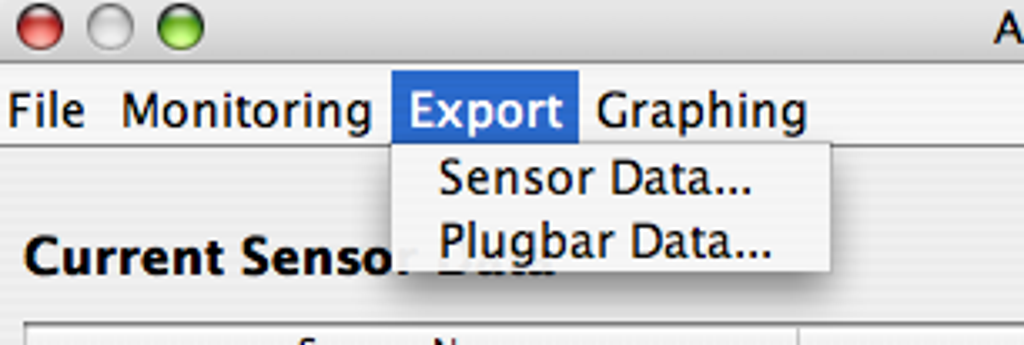
Exporting of sensor and plug data to Excel is supported.
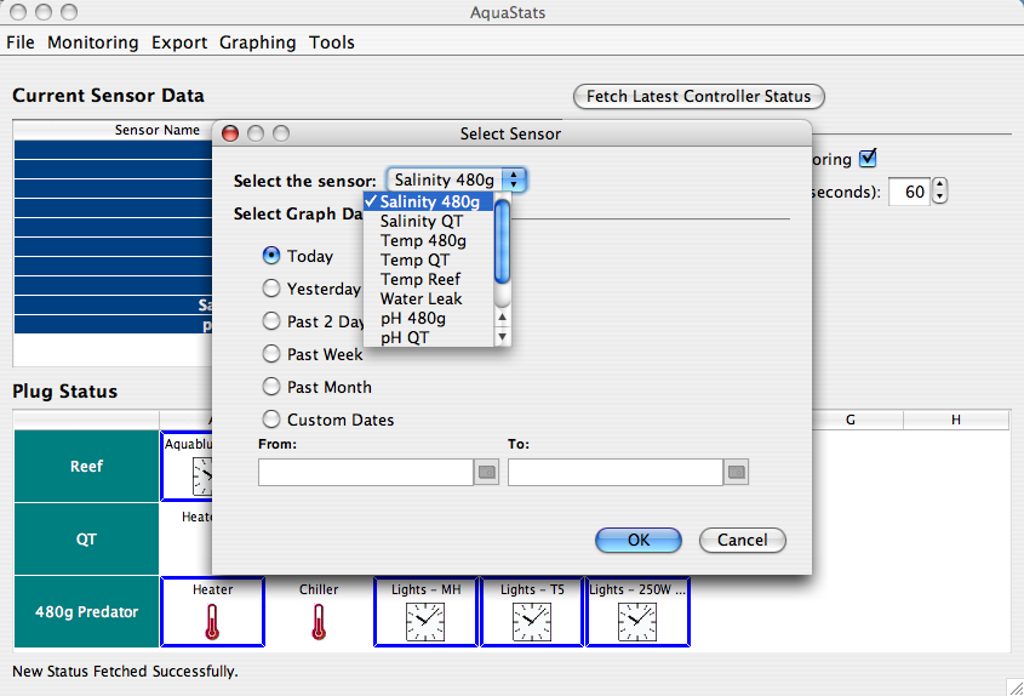
Graphing and exporting allows you to select your sensor or plug.
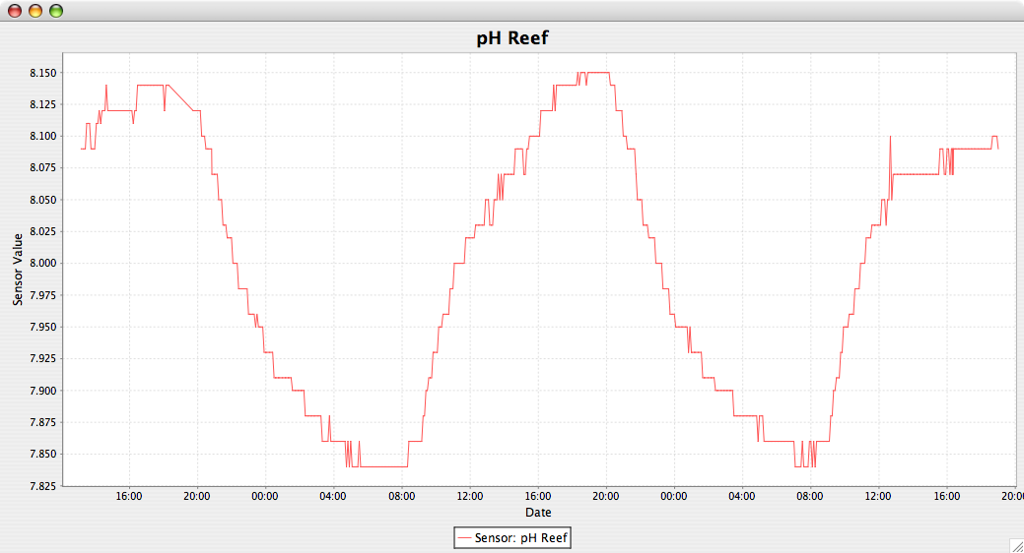
It is possible to generate very high resolution graphs of any sensor data. It is clear from this picture that the probe has some "jitter" in the data - i.e. this is where resolution and accuracy is visualized.
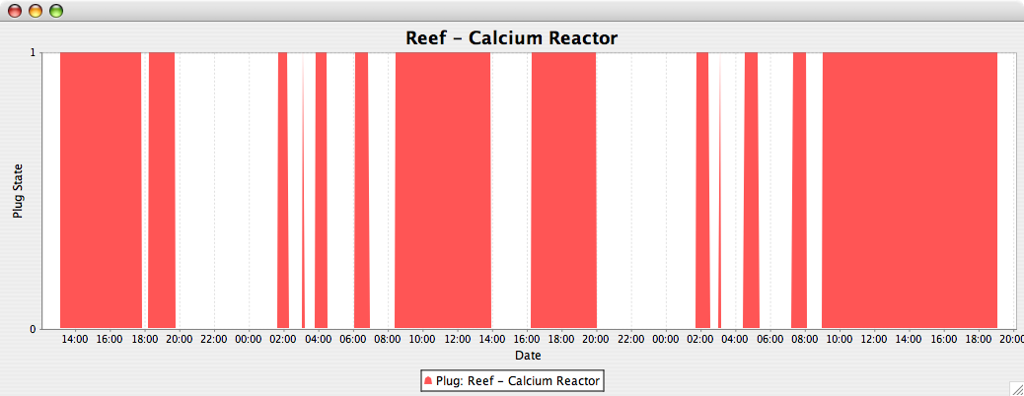
Most probably one of the most unique features of this application is the ability to graph your power unit's plug statuses. If you are wondering why this is a good idea - just think how you can detect whether your heaters or chillers come on excessively or whether the CO2 solenoid is turned on and off too rapidly. In a future release the total duration of time any given device was turned on will also be displayed, allowing you to calculate power consumption etc.
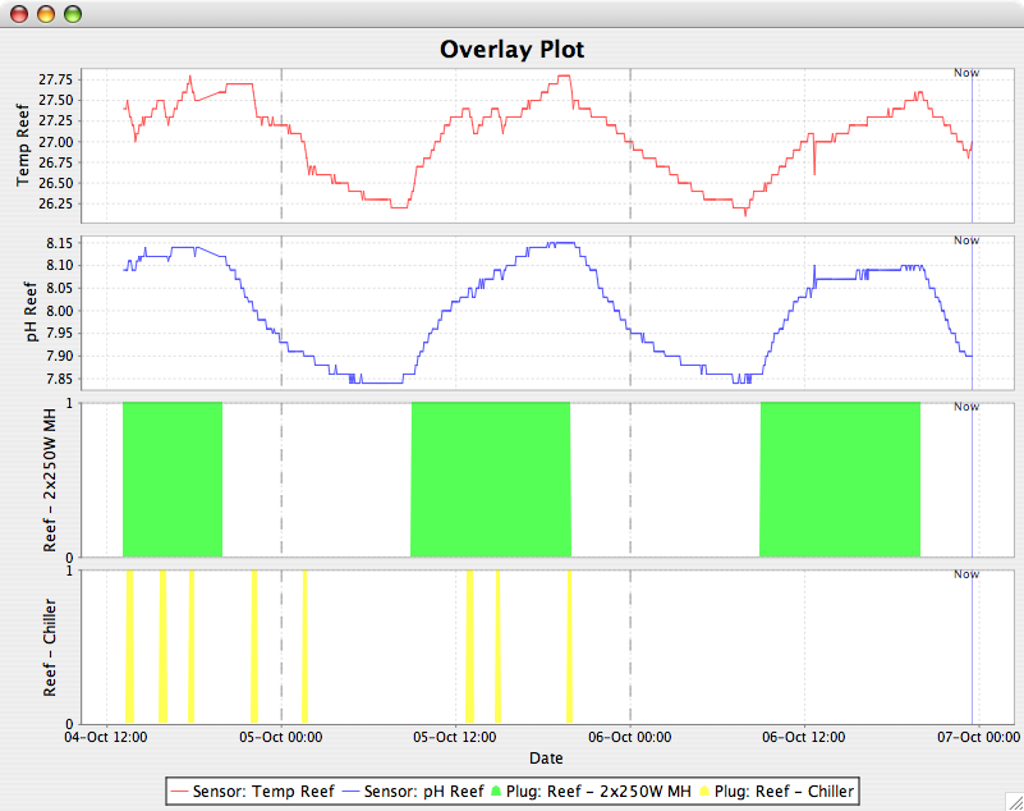
Another unique feature is the ability to overlay multiple graphs to see the relationship between various things - a feature requested by RobbyG @ ReefCentral.
It can clearly be seen how the metal halide lights encourage photosynthesis in the coral and algae, raising dissolved oxygen and ultimately raising pH. The rise in temperature also corresponds quite well with the lighting period - however this is only a contributing factor as the major factor is most certainly the heat from the passing daylight.
The effect of the chiller can also clearly be seen. I now know for the first time my chiller is not on excessively and the temperature curve I programmed in to my Aquatronica is a good representation of the natural heating/cooling process.
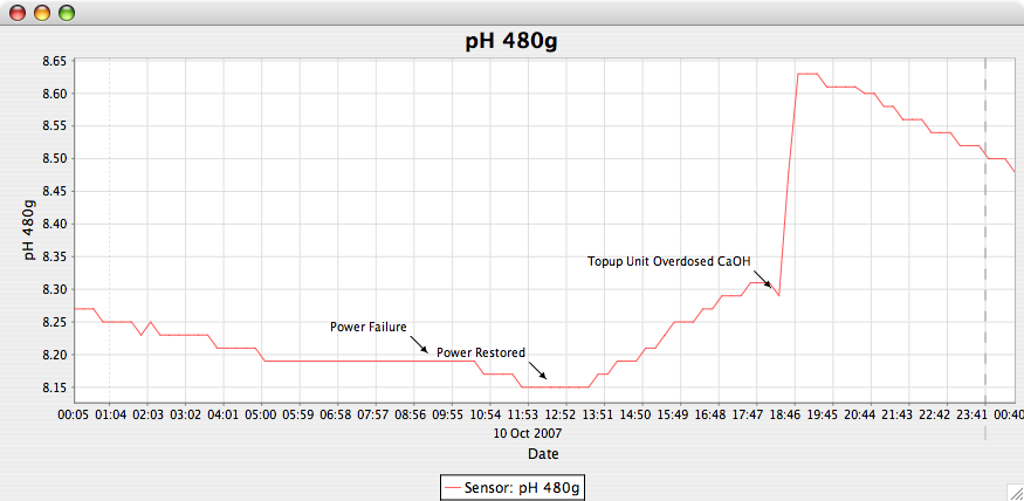
Another unique feature of this application is the ability to plot annotations on the graph itself of any major water chemistry affecting event. This picture explains the benefits well enough.
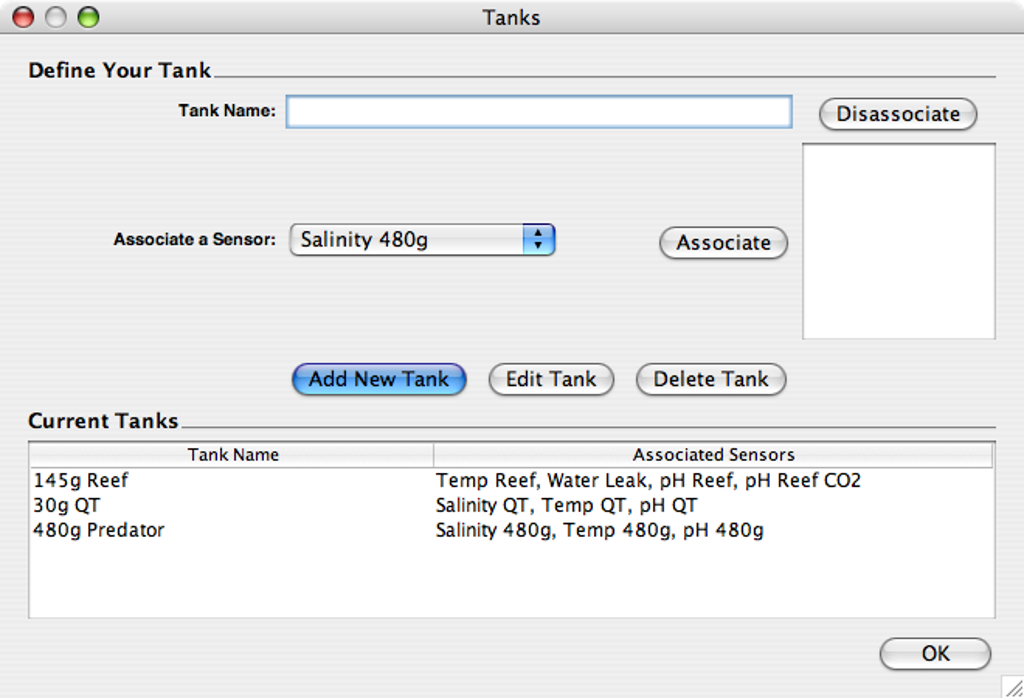
To support the annotations on the graph above, a tank and tank maintenance log facility was added. This allows you to define your tanks and the sensors applicable to them.
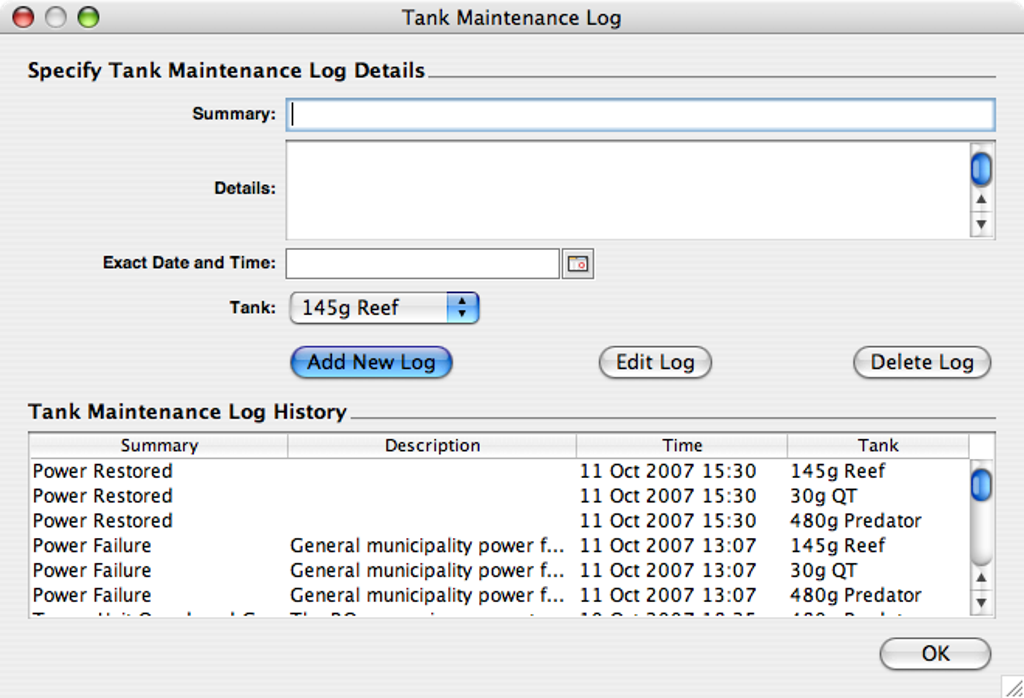
Once the tanks are defined, actual events can be captured on an exact time (down to the minute), and associated with a tank. The system will then automatically plot these log entries as annotations on the graphs, at the correct point in time.
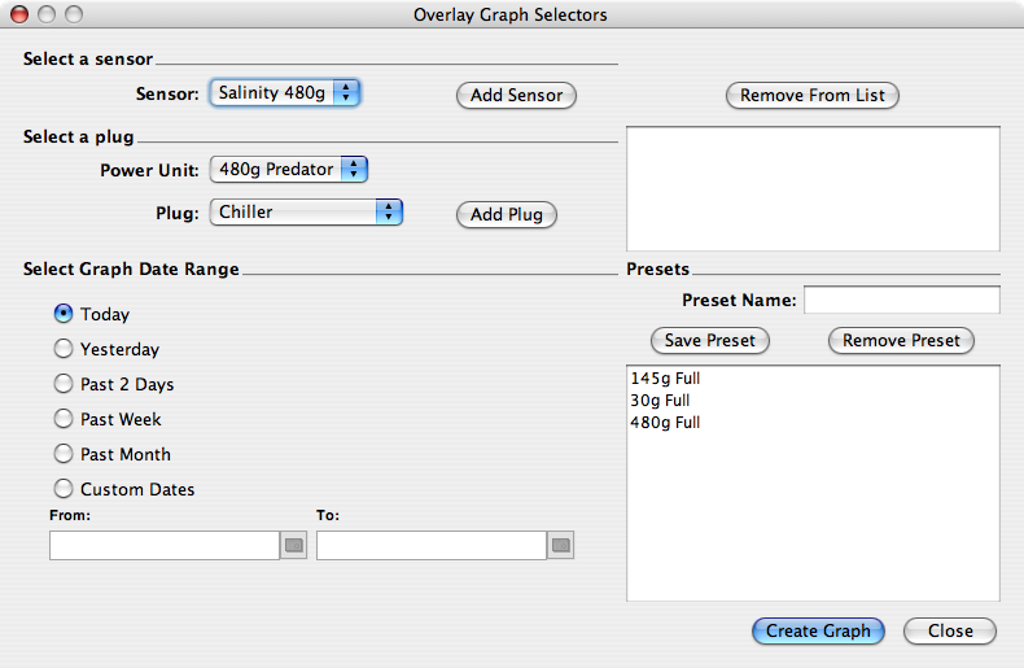
Overlay graphs can combine any set of sensor and plug combinations you desire. Common groupings can not be saved as a preset in order to recall it quickly.
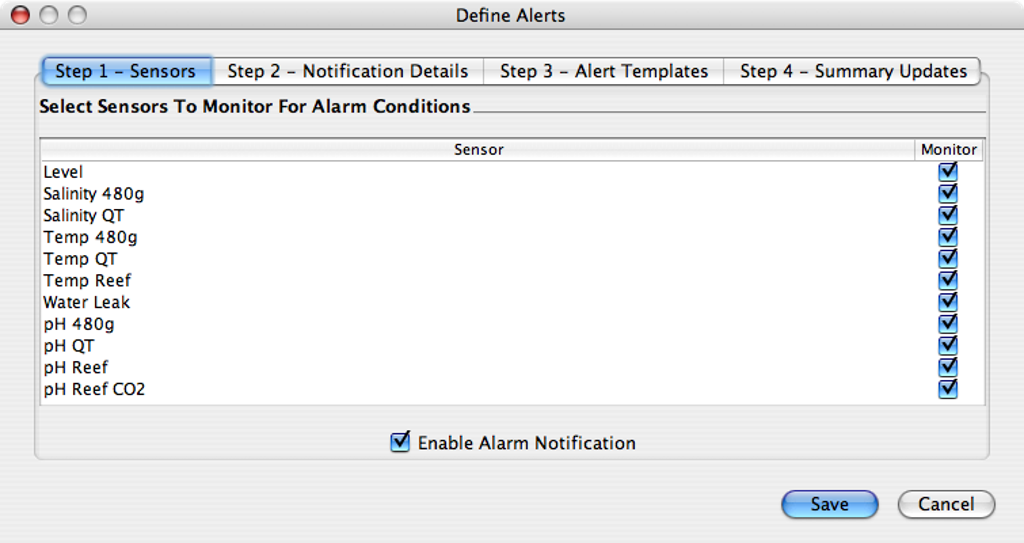
The new alert module allows you to select an alert monitor per sensor - unlike the Ethernet controller that limits you to a type of sensor.
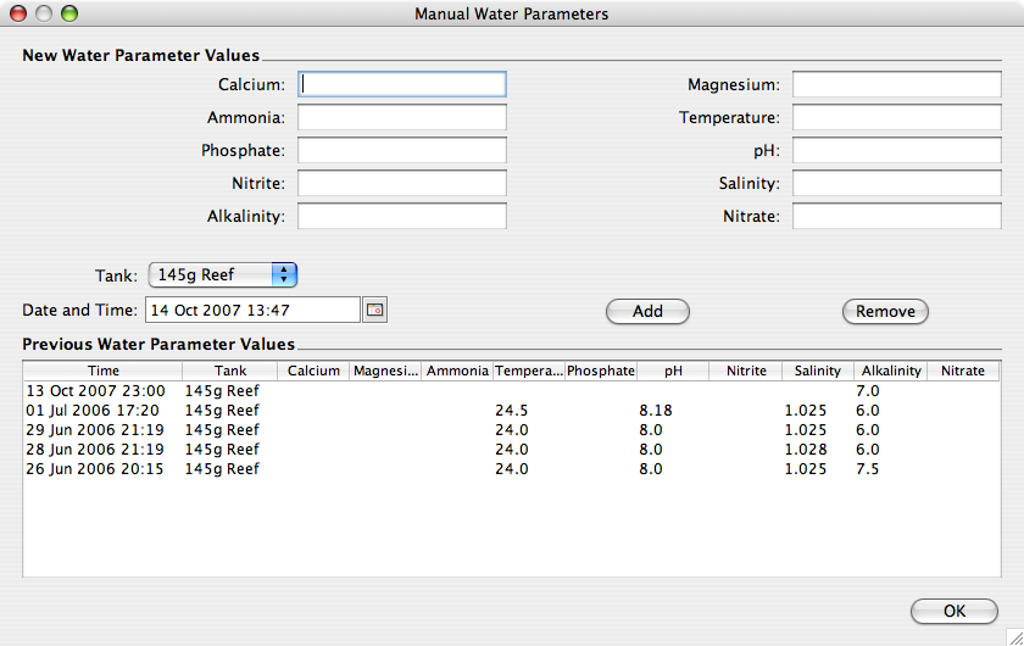
Another new module - manual water parameters. Ideally we would have electronic sensors connected to the Aquatronica for all the water parameters we need to monitor. Unfortunately most water parameters are not practical or possible to monitor electronically, such as Alkalinity, Nitrite etc. This is why I have added a module where one can specify all these parameters you do not monitor using the Aquatronica. These parameters can be exported and graphed just like any other parameter.
If you are interested in this application, feel free to download it from the links below.
Important Information
- Make sure to download the aquatronica_db.zip file too if this is the first time you install the application. Extract the contents so that the directory "aquatronica" is in the directory where"AquaStats.jar" is - which was extracted from the aquatronica_1.1.x.zip file earlier. DO NOT extract this database file again once you have a database otherwise you will loose all your current data! See here for detailed first time installation instructions.
- To run, just double click on "AquaStats.jar".
- For the technically minded there are log files in the log subdirectory.
- Enjoy!
New Installation Instructions
-
Make sure to download and install the latest Sun Java JRE for your operating system. You will
typically need Java 1.5 (Java 5) or Java 1.6 (Java 6). Fetch it here if you do not
already have it installed. To see whether your computer already has it installed, launch Command
Prompt (usually located in the Accessories sub menu of the Start Menu), and type:
C:\Users\waldo>java -version
'java' is not recognized as an internal or external command,
operable program or batch file.
If you see the message above you do not have java installed. If you see a simmilar message to the one below, and it mentions version 1.5 or 1.6 or higher, it should be all good to go:
C:\Users\waldo>java -version java version "1.6.0_14" Java(TM) SE Runtime Environment (build 1.6.0_14-b08) Java HotSpot(TM) 64-Bit Server VM (build 14.0-b16, mixed mode) - Download Aquatronica_db.zip from the table below (right at the bottom). This is your blank embedded database for use in the embedded Derby database mode.
- Download the latest AquaStats.zip file from the table below (right at the top). Always download the latest release as this is usually the most stable and reliable build.
- On your computer, make a new folder (directory) anywhere where you have full read/write access. Note that on Vista and Windows 7 I strongly recommend *against* the C:\Program Files\ directory. Rather use your home (documents) directory.
-
Extract the contents of AquaStats.zip (named something like aquastats_1_2_5c.zip) in to this directory.
If done correctly, and lets assume you used the directory C:\Users\myusername\Documents\AquaStats,
then your directory structure must look like this (green indicates
directories, rest are files):
C:\Users\myusername\Documents\AquaStats
\---aquastats
    |   activation.jar
    |   AquaStats.jar
    |   commons-codec-1.3.jar
    |   dblayer.jar
    |   derby.jar
    |   dom4j-full.jar
    |   forms.jar
    |   javaconfig.jar
    |   jcalendar-1.3.2.jar
    |   jcommon-1.0.10.jar
    |   jfreechart-1.0.6.jar
    |   log4j-1.2.15.jar
    |   LogMonClientAPI.jar
    |   looks-1.2.2.jar
    |   mail.jar
    |   postgresql-8.1-407.jdbc3.jar
    |   xercesImpl.jar
    \---log
Take note that all the files in the zip file reside inside a subfolder called aquastats, inside the folder you just created. - In Explorer, go to the directory C:\Users\myusername\Documents\AquaStats\aquastats.
-
Extract the contents of the Aquatronica_db.zip file inside this directory. Your directory structure must
look like this (abbreviated for presentation):
C:\Users\myusername\Documents\AquaStats
\---aquastats
    |   activation.jar
    |   AquaStats.jar
    |   commons-codec-1.3.jar
    |   dblayer.jar
    |   derby.jar
    |   dom4j-full.jar
    |   forms.jar
    |   javaconfig.jar
    |   jcalendar-1.3.2.jar
    |   jcommon-1.0.10.jar
    |   jfreechart-1.0.6.jar
    |   log4j-1.2.15.jar
    |   LogMonClientAPI.jar
    |   looks-1.2.2.jar
    |   mail.jar
    |   postgresql-8.1-407.jdbc3.jar
    |   xercesImpl.jar
    |
    +---aquatronica
    |   |   service.properties
    |   |
    |   +---log
    |   |       log.ctrl
    |   |       log1.dat
    |   |       logmirror.ctrl
    |   |
    |   \---seg0
    |           c10.dat
    |           c101.dat
    |           c111.dat
    ...         ...
    |           cf0.dat
    |
    \---log
It is extremely important that the "aquatronica" folder inside the Aquatronica_db.zip file be in the *same* directory as the AquaStats.jar file, as per above. The aquatronica folder contains the embedded Derby database files and should not be manipulated in any way. - Double click AquaStats.jar file. If all is well, it should start up after a couple of seconds. You can then go to File | Preferences and configure the system.
Downloads
| File | Date | Version | Change Log |
|---|---|---|---|
| AquaStats-src.zip | 13 Nov '10 16:30 PST | 1.2.5c GPL |
|
| AquaStats.zip | 27 May '09 12:11 PST | 1.2.5c |
|
| AquaStats.zip | 16 Oct '08 21:40 CDT | 1.2.5b |
|
| AquaStats.zip | 23 Jun '08 14:09 | 1.2.5a |
|
| AquaStats.zip | 3 Jun '08 23:57 | 1.2.5p1 | Please take note that this is an identical release to 1.2.5, but it seems in the
upload process an old (incorrect) version was uploaded as 1.2.5, and caching seems to interfere with me
uploading the correct version. So this version should be used instead if you receive DB patch fail
errors.
|
| AquaStats.zip | 30 Mar '08 15:40 | 1.2.4a |
|
| AquaStats.zip | 30 Mar '08 10:12 | 1.2.4 |
|
| AquaStats.zip | 16 Mar '08 11:41 | 1.2.3d |
|
| AquaStats.zip | 27 Jan '08 18:08 | 1.2.3c |
|
| AquaStats.zip | 22 Jan '08 15:46 | 1.2.3b |
|
| AquaStats.zip | 20 Jan '08 11:18 | 1.2.3a |
|
| AquaStats.zip | 17 Jan '08 09:00 | 1.2.3 |
|
| AquaStats.zip | 31 Dec '07 16:00 | 1.2.2 |
|
| AquaStats.zip | 22 Dec '07 11:23 | 1.2.1 |
|
| AquaStats.zip | 13 Dec '07 01:13 | 1.2.0 | THIS IS A MAJOR UPDATE. This update makes massive data changes to your sampled
data. It is in your best interest to make sure you have a working backup of both the DB and the
application files before running this new version. Once it has upgraded your data, there is no
going back.
|
| AquaStats.zip | 7 Nov '07 10:17 | 1.1.5 |
|
| AquaStats.zip | 18 Oct '07 10:47 | 1.1.4 |
|
| AquaStats.zip | 17 Oct '07 21:27 | 1.1.3 |
|
| AquaStats.zip | 16 Oct '07 16:41 | 1.1.2 |
|
| AquaStats.zip | 14 Oct '07 13:53 | 1.1.1 |
|
| Aquatronica.zip | 11 Oct '07 00:47 | 1.1.0 |
|
| Aquatronica.zip | 9 Oct '07 00:48 | 1.0.5 |
|
| Aquatronica.zip | 8 Oct '07 00:17 | 1.0.4 |
|
| 6 Oct '07 23:40 | 1.0.2 |
|
|
| 6 Oct '07 21:20 | 1.0.1 |
|